Overview
Table of Contents
Coinrule is an automated trading platform that allows users to configure rule-based trading strategies using pre-built templates and indicators. This page covers safety considerations specific to using Coinrule templates. It does not constitute investment advice or a recommendation to use any specific template or strategy. No automated trading template guarantees profit.
Automation Risk Notes
Automated trading templates execute trades based on pre-defined conditions without manual intervention. This means errors in template configuration, unexpected market conditions, or exchange outages can result in unintended trades executing at scale before the user has an opportunity to intervene. Test any new template configuration with a small position size before deploying with significant capital.
Templates sourced from third-party communities, marketplaces, or social channels carry additional risk. The performance history, methodology, and incentives of template creators are not independently verifiable. A template that performed well in a specific historical period may perform poorly in different market conditions. Backtested results shown in any template description do not guarantee future results in live trading.
Coinrule connects to exchange accounts via API keys. API keys used with Coinrule or any third-party trading platform should be configured with trade permissions only. Never grant withdrawal permissions to a third-party bot. Regularly audit which applications have active API access to your exchange account.
Part I – Coinrule strategies summary
This part is not direct investment advice, but rather a short guide on different points that can help when creating your own trading strategy with Coinrule.
>Buying the dip
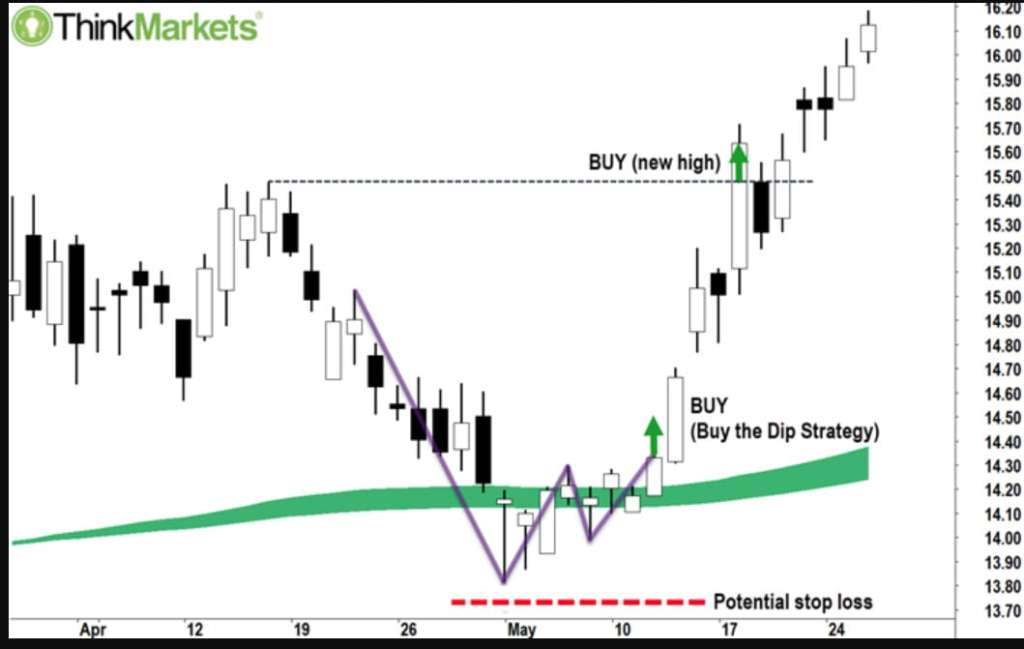
Buying the dip strategies assume an underlying uptrend. In the absence of an uptrend, repeated dip-buying accumulates losses. Always configure a stop-loss.
We’ll start off with the one that is the easiest to understand and probably most suitable for beginners: Buying the dip. What does this mean? In short, you have to identify a larger uptrend and capitalize on the smaller dips along the way. For example, if a coin went up 10% on the last day, but on a scale of the last two hours dipped 2%, it may be a sign of an underlying uptrend. This is just a simplification, and we advise you never to ignore the stop-loss option. Additionally, always use platforms such as TradingView for backtesting historical data or future testing a bit, so that you determine current market volatility and market conditions for your strategy.
>Using moving averages
Moving average is an important concept that can improve your trading strategies. It is basically a group of price averages over time. It helps the understanding of price movement better than a single average because it is more precise, more detailed and better updated. Longer moving average numbers are important trading signals, and even if they cannot predict future movement, they assist in making better predictions.
Moving average that is rising can imply an uptrend in price, while a dropping moving average can imply a price decrease in the future. By the same logic, we can observe the potential bull market if we see a short-term moving average going above a long-term moving average. This is what makes it a solid trading signal.
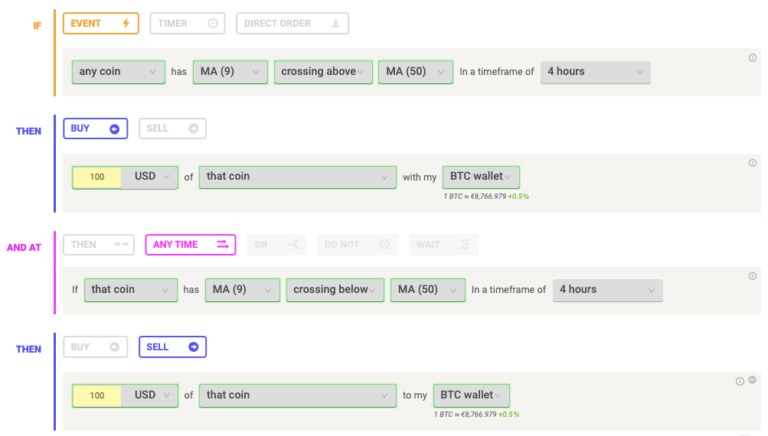
For Coinrule specifically, the learning platform of the Coinrule website offers this take on moving averages. This is an example of the so-called Golden Cross strategy for Coinrule, which can be applied to many different coins. It is an automated strategy that is based on you defining crossovers with moving averages, such as “if the price goes above MA-50”, or dealing with two moving averages parallelly, such as “if MA-100 goes over MA-50”. Ma-50 applies during the period of the last 50 days, while MA-100 refers to the last 100 days.
They also note you should be careful not to overtrade and use limits because this rule tends to automatically generate a lot of signals.
>Using low volatility to your advantage
Low volatility conditions can change rapidly. A template configured for low volatility may execute incorrectly during sudden market moves.
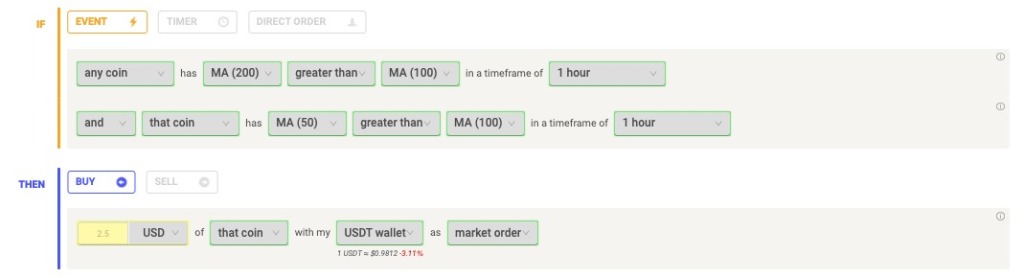
The next point allows you to profit from the opposite of market movement and volatility. When a cryptocurrency market stabilizes, it is the perfect time to be a trendsetter for new movements. This is because, after stability, there often comes shakiness. When the prices start to shake, you want to be the one catching the uptrend. Here, the moving averages also play a role, as they show the inclination of a coin to move upward or downward. For example, an uptrend is signaled if a more recent MA (such as 50 days) is higher than the longer MA ( such as 100 or more days). Here is an example strategy by Fintechmag:
>Part II – An example template
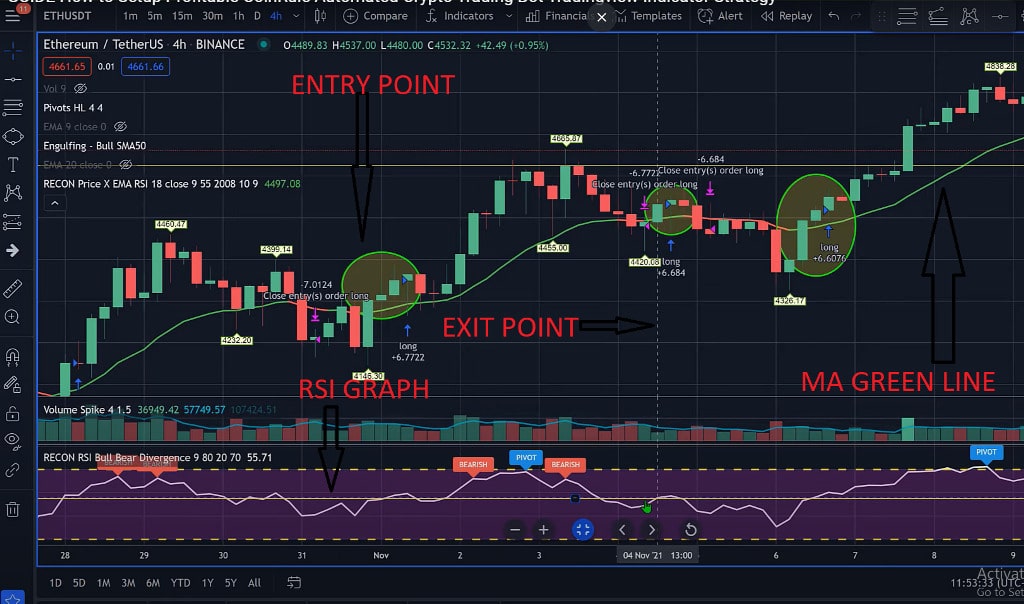
This strategy is a combination of using moving averages exponentially (not linear, more value and stress placed on recent prices), together with TradingView candles and RSI indicators. RSI (Relative Strength Index) tries to identify if the price momentum in a coin is bullish or bearish, and it can identify whether a value has been overvalued or undervalued by traders. An asset is usually considered overbought when the RSI is above 70 and oversold when it is below 30. It is usually found under a graph with candles. This example will be shown in Tradingview. The strategy is made public and free, and the credit goes to the trader group called ReconTraders.
This strategy is looking for the price to cross above the moving average and, at the same time, to have an RSI value over a predefined level, which is 55 in this case. The MA is a trend-based indicator so we are looking for a reversal in a trend. In addition to the RSI, there is a momentum-based indicator, so in theory, an RSI level over 55 should tell us that the momentum is going upwards.
>The chart
In the chart, the MA line is the green and red line, the RSI graph is under it, and the current set threshold (55) is represented by the yellow line. In order for the trade entry to happen, both MA conditions and RSI conditions need to be met. On the other hand, the exit happens when the price crosses below the MA, and RSI drops below 55.
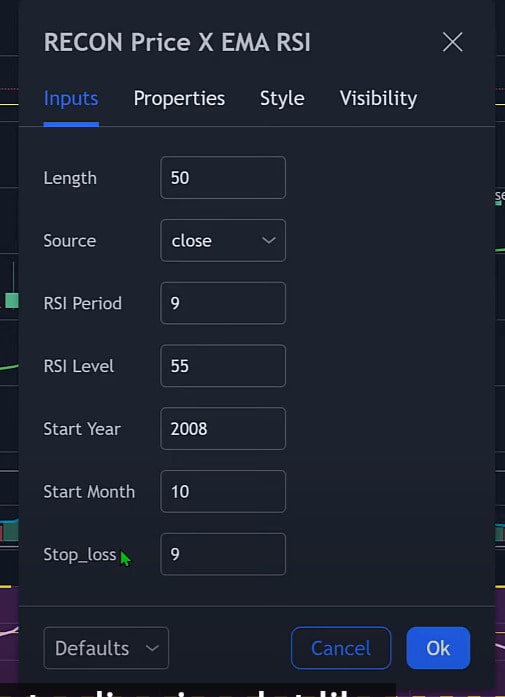
>Indicator test settings
The length of the MA can be set to 50 to test how that would work on a chart. The source should always be the close of the candle. RSI period is 9, and the level is 55, as mentioned. The year should go as far back as possible. The stop loss should always be there, and here it is set at 9 percent.
>No Profit Guarantees
No Coinrule template or automated strategy described on this page guarantees profit. Automated trading amplifies both gains and losses depending on market conditions and template configuration. ScammerWatch does not recommend Coinrule or any specific trading template. If you have encountered a trading bot platform or template marketplace that you believe has misled users about expected returns, submit a report at scammerwatch.com/report-a-scam..
>FAQ
The best strategy in general is the one with the best risk management. If you are a skilled manager of your bankroll and trades, and you tread carefully, you will get to explore all kinds of strategies and hopefully find what is profitable and what suits your trading style.
Coinrule has all the prerequisites to being a good bot. It is verified, trusted, and has a decent-sized community behind it. Moreover, it is extremely beginner-friendly and could be a great choice for creating your first strategies, as well as testing, implementing templates, and so on.
This may sound strange, but this is not a valid question. The question is, can you consistently make a few percent profits from your investments? If you can, then $100$ a day is not a problem, because you can set your own trading rules, and then the sky is the limit.